
Results
RUSSIA IN COMPARISON WITH OTHER COUNTRIES
Crosstables for all questions comparable between Russia and ESS countries for rounds 1 to 11 in Russian language (to read only, to download go to DOWNLOAD page)
COMPARISON BETWEEN COUNTRIES
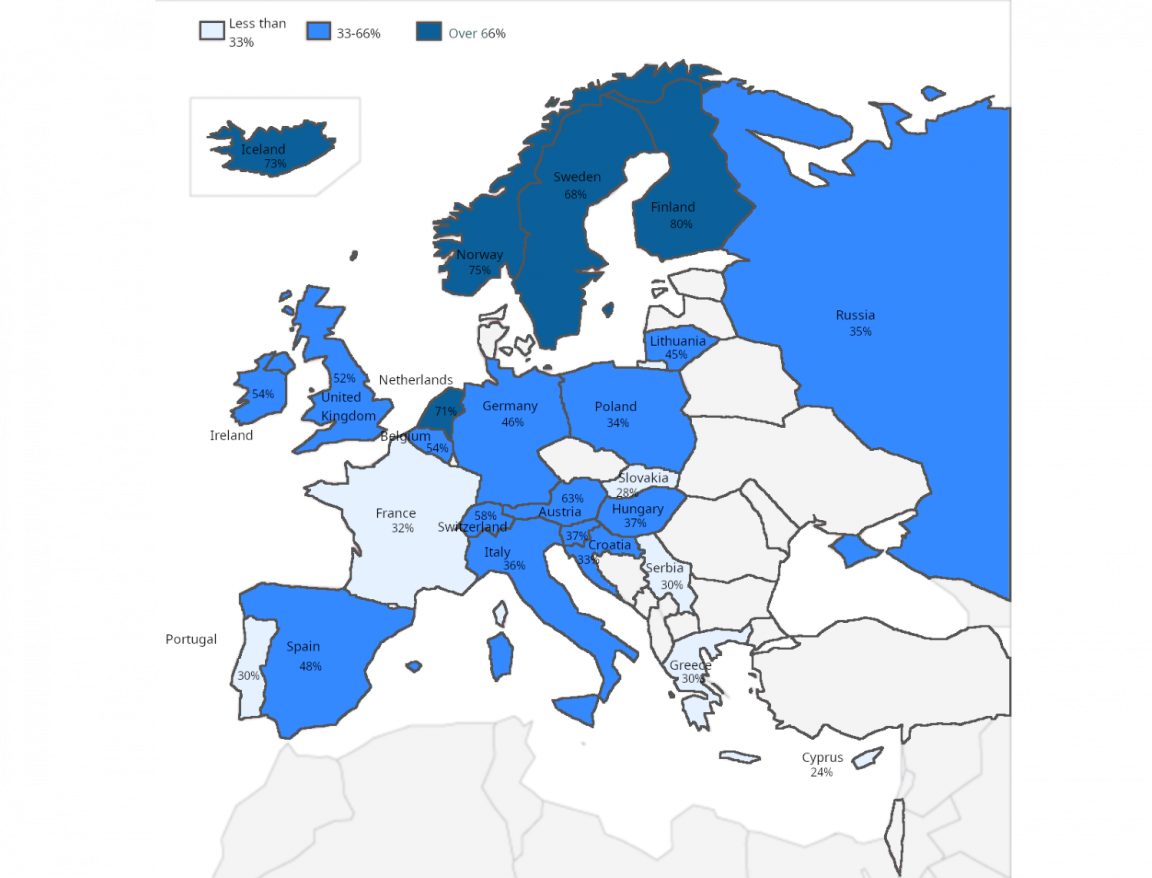
INTERPERSONAL TRUST – COMPARISON OF COUNTRIES
Question: Generally speaking, would you say that most people can be trusted, or that you can’t be too careful in dealing with people? (А4)
Answers on the scale from 0 to 11 (0- you can not be too careful, 10- most people can be trusted, codes Refused to answer and Unsure are included but not showed to respondents).
Time period: Round 11 (2024 year)
Data on the map: share of respondents who think that most people can be trusted (codes 6-10), colors mean - less than 33%, 33-66% and 66% or more.
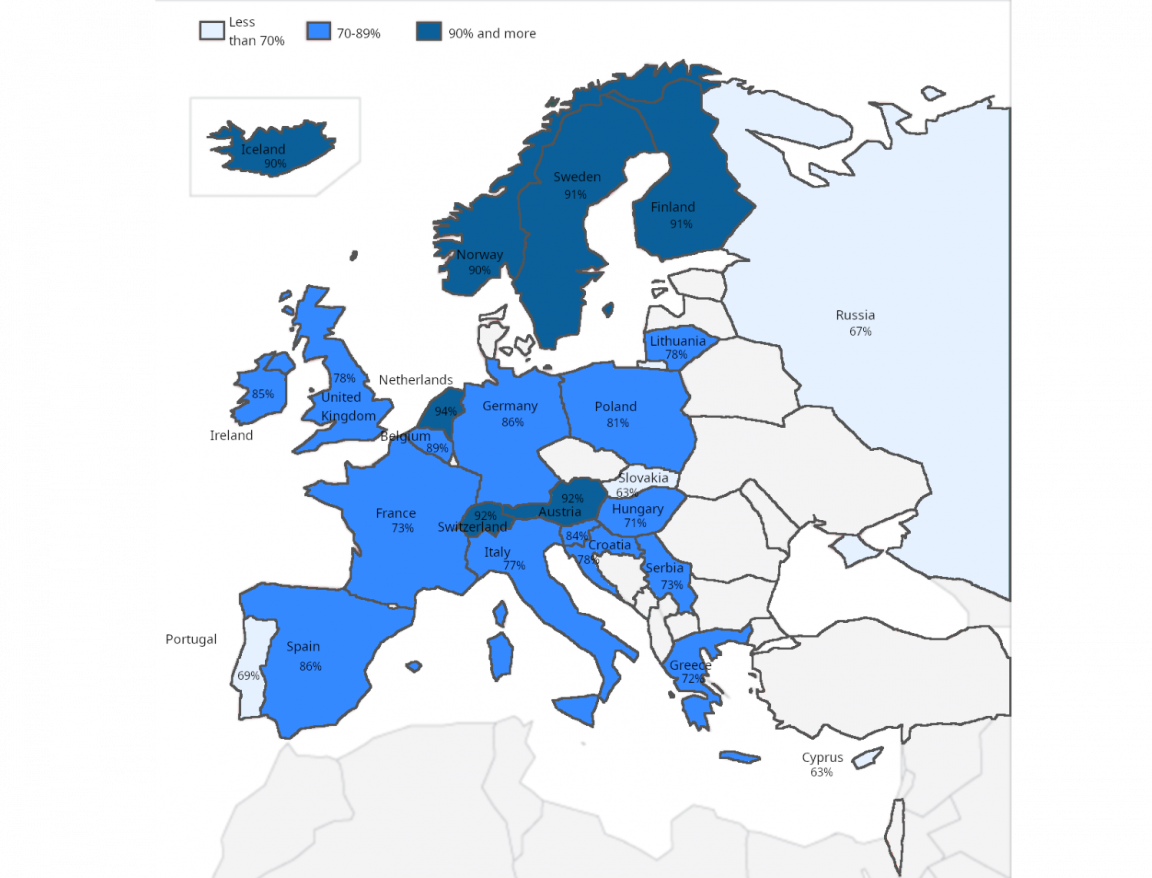
Satisfaction with life as a whole – comparison of countries
Question: All things considered, how satisfied are you with your life as a whole nowadays? (B27).
Answers on the scale from 0 to 11 (0- extremely dissatisfied, 10-extremely satisfied), codes Refused to answer and Unsure are included but not showed to respondents).
Time period: Round 11 (2024 year)
Data on the map: share of respondents who evaluated their satisfaction with life as a whole on 6-10, colors mean – less than 70%, 70-89% and 90% or more.
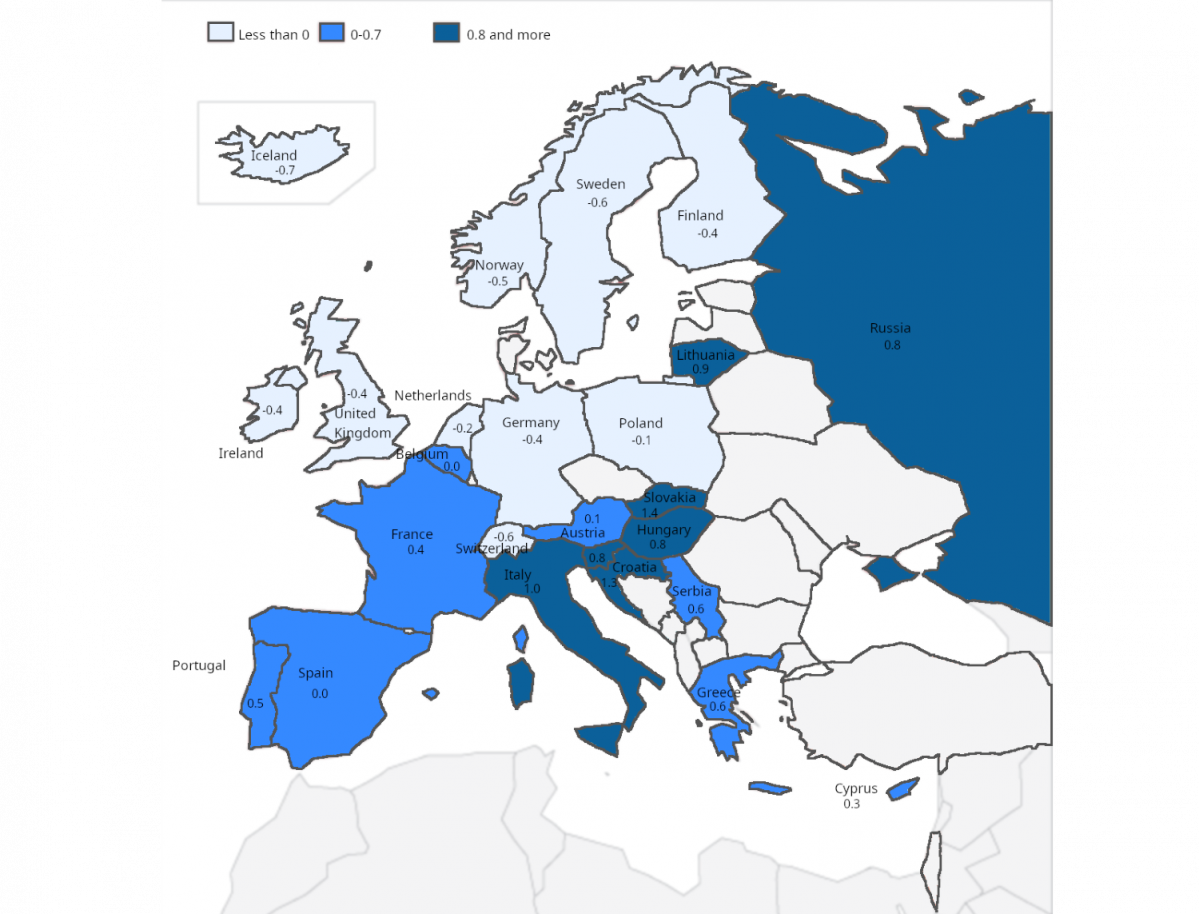
Intergenerational gap in satisfaction with life – comparison of countries
Question: All things considered, how satisfied are you with your life as a whole nowadays? (B27).
Answers on the scale from 0 to 11 (0- extremely dissatisfied, 10-extremely satisfied), codes Refused to answer and Unsure are included but not showed to respondents).
Time period: Round 11 (2024 year)
Data on the map: differences in mean values on satisfaction with life as a whole scale between younger respondents (15-29 years old) and older respondents (60 years old and over). The colors mean - the difference of means is 0.01 or less (including negative), the difference is between 0.01 and 0.7 points (in favor on young group), the difference is 0.8 points or more.
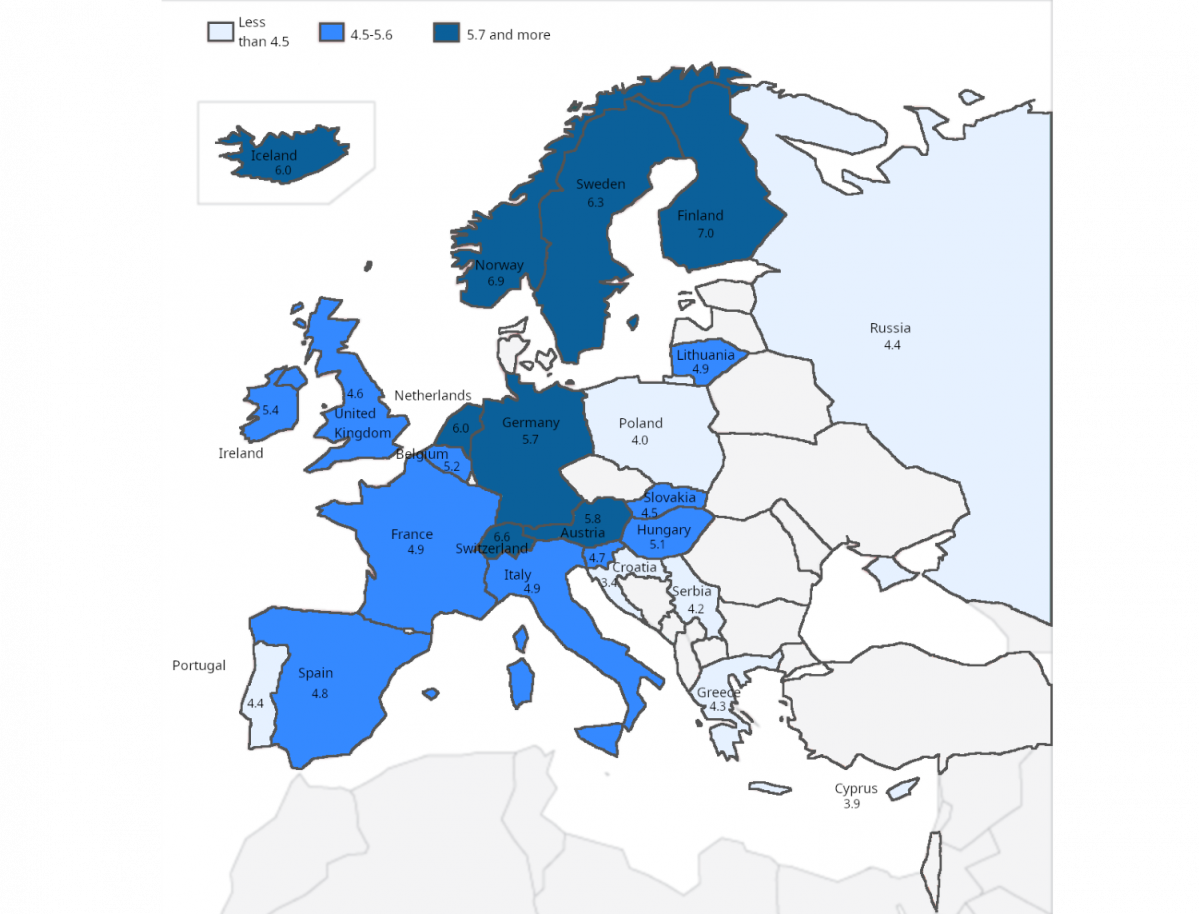
Index of institutional trust – comparison of countries
Summary Index based on questions B6-B10.
Question: How much you personally trust each of the following institutions?
Answers on the scale from 0 to 11 (0- do not trust at all, 10 – completely trust), codes Refused to answer and Unsure are included but not showed to respondents). B6 – State Duma, B7- legal system, B8- police, B9 – politicians, B10 - political parties.
Index – the scale from 0 to 10 where 0 means low level of institutional trust and 10 – high level.
Time period: Round 11 (2024 year)
Data on the map: mean value of Index of institutional trust, scale from 0 to 10. The colors mean - Index is less than 4,5; from 4,5 to 5,6 and 5,7 or higher.
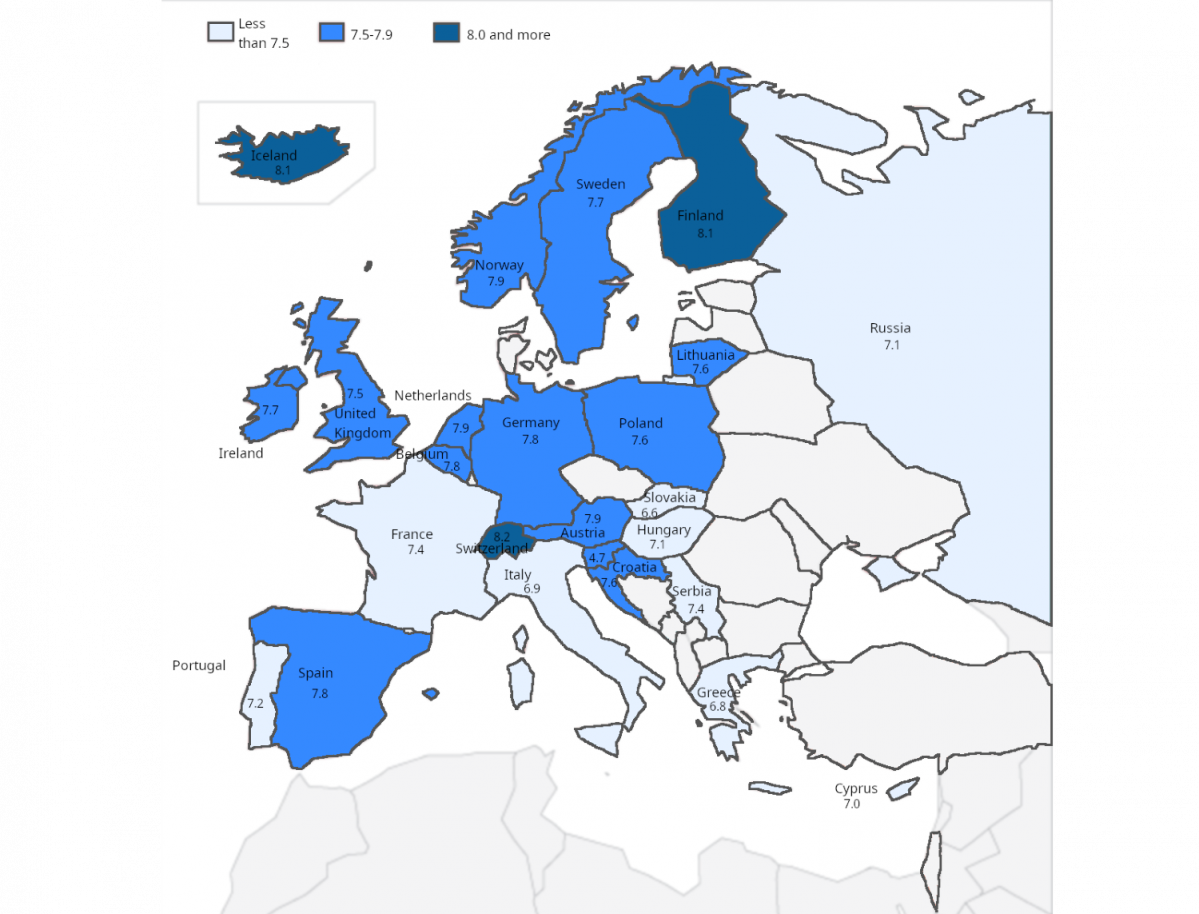
Happiness – comparison of countries
Question: Taking all things together, how happy would you say you are? (С1).
Answers on the scale from 0 to 11 (0 -“extremely unhappy”, 10 – «extremely happy»), codes Refused to answer and Unsure are included but not showed to respondents).
Time period: Round 11 (2024 year)
Data on the map: mean value of happiness scale from 0 to 10, colors mean the mean is lower than 7,5; from 7,5 to 7,9; 8,0 or more.
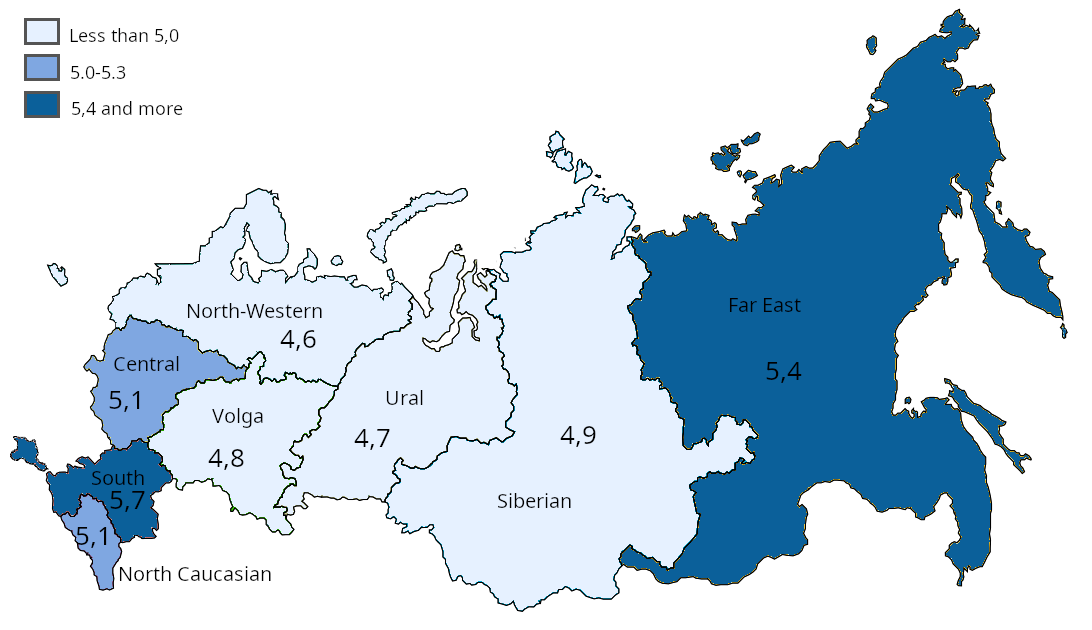
Satisfaction with health services in Russia – comparison of federal okrugs
Question: what you think overall about the state of health services in our country nowadays? (B32).
Answers on the scale from 0 to 11 (0 -“extremely bad”, 10 – «extremely good», codes Refused to answer and Unsure are included but not showed to respondents).
Time period: Round 11 (2024 year)
Data on the graph: mean value of health services evaluation on the scale from 0 to 10. The colors mean: lower than 5,0 points; from 5,0 to 5,3; 5,4 points or more.
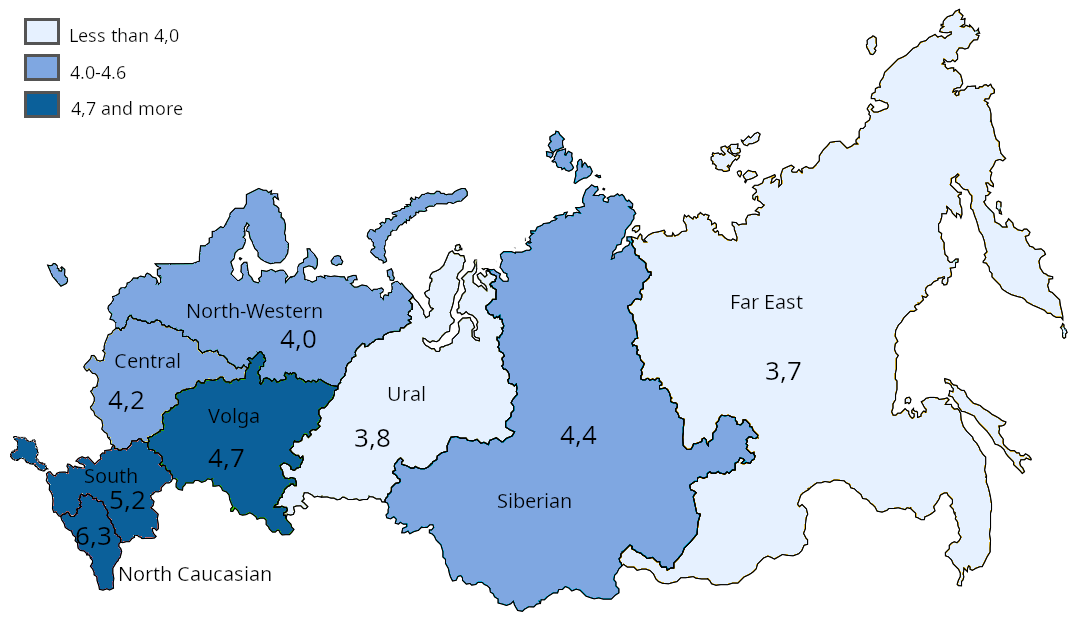
Level of religiosity – comparison of federal okrugs of Russia
Question: Regardless of whether you belong to a particular religion, how religious would you say you are? (C15).
Answers on the scale from 0 to 11 (0 -“not at all religious”, 10 – «very religious», codes Refused to answer and Unsure are included but not showed to respondents).
Time period: Round 11 (2024 year)
Data on the map: mean value on religiosity scale from 0 to 10. Colors mean: mean value less than 4,0; from 4,0 to 4,6; 4,7 or more.
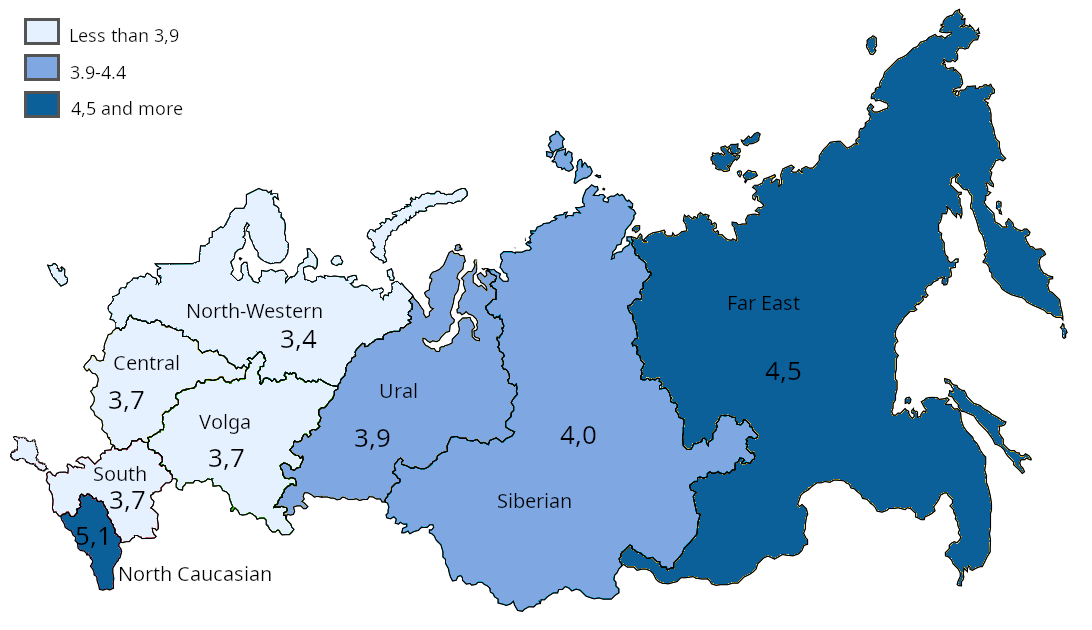
Index of attitude toward immigrants – comparison of federal okrugs of Russia
Summary index based on questions B43-B44-B45.
Questions. Would you say it is generally bad or good for Russia’s economy that people come to live here from other countries? (B43), answers on the scale from 0 to 10, 0 means “bad for the economy”, 10 – good for the economy. Would you say that Russia’s cultural life is generally undermined or enriched by people coming to live here from other countries? (B44), answers on the scale from 0 to 10, 0 means “cultural life undermined”, 10 – cultural life enriched). Is Russia made a worse or a better place to live by people coming to live here from other countries? (B45 ), answers on the scale from 0 to 10, 0 means “worse place to live”, 10 – better place to live).
Index – scale from 0 to 10, where 0 means negative attitude toward migration and 10 – positive.
Time period: Round 11 (2024 year)
Data on the map: mean value on Index from 0 to 10. Colors mean: mean value less than 3,9; from 3,9 to 4,4; 4,5 or more.
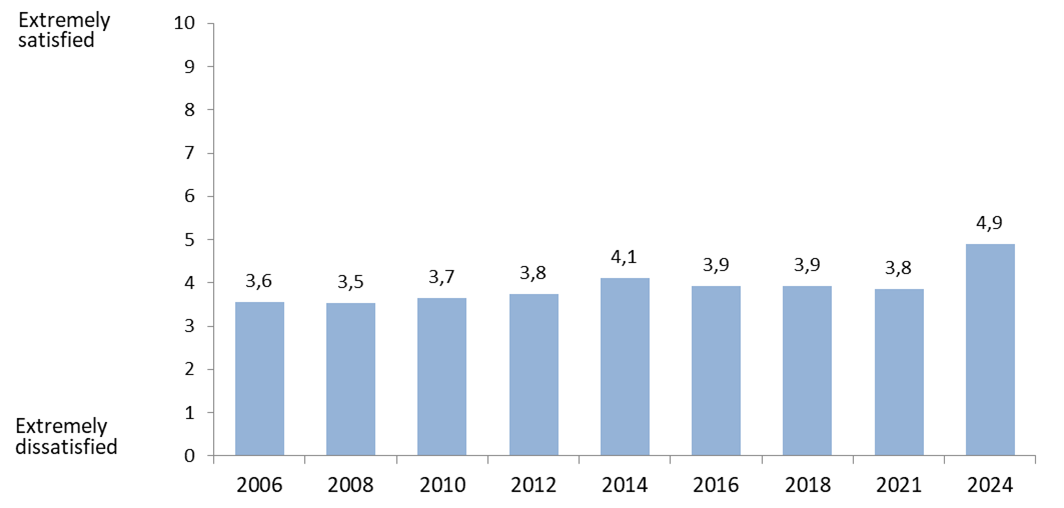
Satisfaction with national economy – time dynamic
Question: On the whole how satisfied are you with the present state of the economy in Russia? (B28).
Answers on the scale from 0 to 11 (0- extremely dissatisfied, 10-extremely satisfied), codes Refused to answer and Unsure are included but not showed to respondents).
Time: from 2006 to 2024
Data on the graph: mean on satisfaction scale from 0 to 10 in different time points.
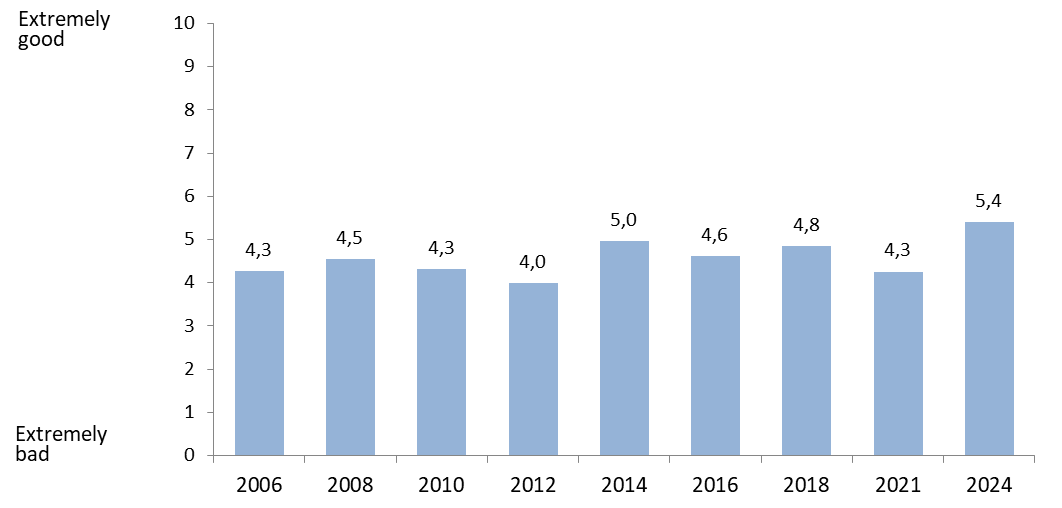
Evaluation of the state of education in Russia – time dynamic
Question: What you think overall about the state of education in our country nowadays? (B31).
Answers on the scale from 0 to 11 (0 -“extremely bad”, 10 – «extremely good»), codes Refused to answer and Unsure are included but not showed to respondents).
Time: from 2006 to 2024
Data on the graph: mean on scale from 0 to 10 in different time points.
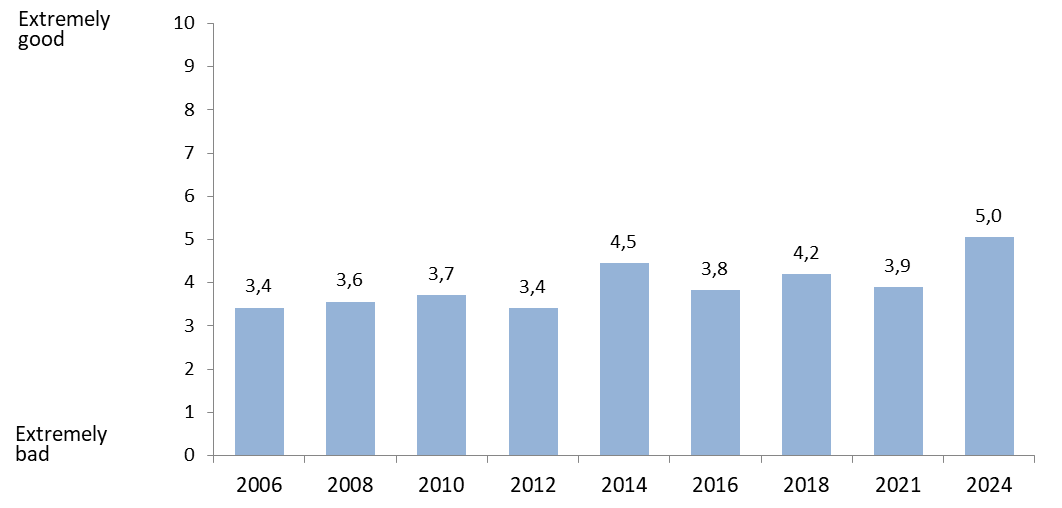
Evaluation of the state of health services in Russia – time dynamic
Question: What you think overall about the state of health services in our country nowadays? (B32).
Answers on the scale from 0 to 11 (0 -“extremely bad”, 10 – «extremely good»), codes Refused to answer and Unsure are included but not showed to respondents).
Time: from 2006 to 2024
Data on the graph: mean on scale from 0 to 10 in different time points.
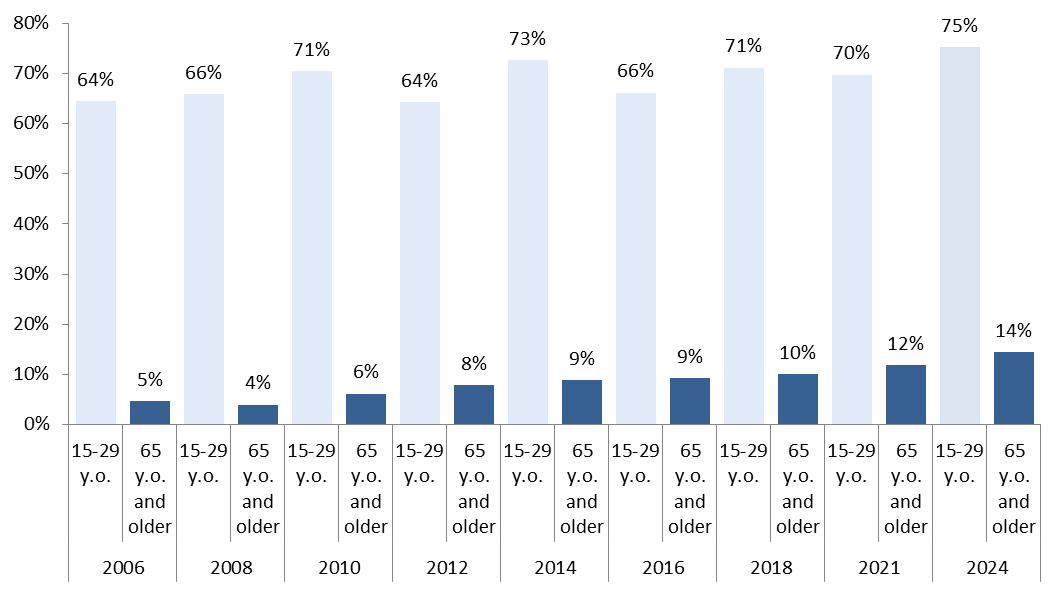
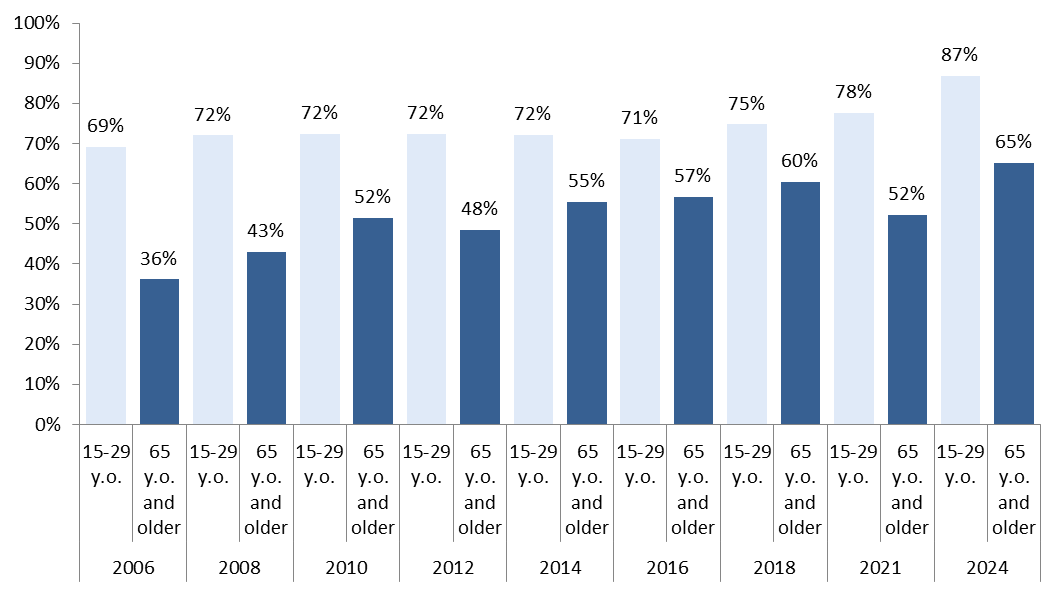
Evaluation of the health of different generations in Russia – time dynamic
Question: How is your health in general – very good, good, fair, bad or very bad (C7).
Codes Refused to answer and Unsure are included but not showed to respondents).
Time: from 2006 to 2024
Data on the graph: % of those who evaluated their health as excellent or good among two groups – young people (15-30 years old) and older people (65 years old and over) in different time points.
Level of happiness – intergenerational comparisons by time points
Questions: Taking all things together, how happy would you say you are? (С1).
Answers on the scale from 0 to 11 (0 -“extremely unhappy”, 10 – «extremely happy»), codes Refused to answer and Unsure are included but not showed to respondents).
Time: from 2006 to 2024
Data on the graph: % of those who evaluated their happiness on 6 to 10 on scale from 0 to 10 among two groups – young people (15-30 years old) and older people (65 years old and over) in different time points.